
Do Candlestick Patterns Actually Work? What the Research Actually Says
Published candlestick research is mixed and highly method-dependent. Here is what major studies tested, what they found, and how to assess reliability claims.
The honest answer is not “yes” or “no.” Published research does not support a universal candlestick-pattern win rate, but it also does not justify declaring every pattern useless in every market. Results change with the market, period, timeframe, pattern definition, exit rule, benchmark, transaction costs, and the statistical controls applied.
That is less satisfying than a ranked list of “the most accurate candles.” It is also much more useful. A candlestick is a compact description of open, high, low, and close prices. Whether a named arrangement predicts a future outcome is an empirical question—and every empirical answer has a scope.
This article reviews several studies named in the Stick Stock editorial roadmap, explains why their results differ, and turns the evidence into a practical standard for evaluating claims. It is not a recommendation to buy or sell, and it does not assume that a historical result will persist.
What would “work” actually mean?
Before comparing studies, define the outcome. “The pattern worked” might mean any of the following:
- price moved in the textbook direction on the next bar;
- the average return after a fixed holding period was above zero;
- a trading rule beat a random or bootstrap benchmark;
- the rule beat buy-and-hold;
- the rule remained profitable after costs;
- the result was statistically distinguishable from chance;
- the result survived an out-of-sample test.
These are not interchangeable. A pattern can be directionally correct slightly more often than half the time and still lose money if losses are larger than gains. It can produce a positive average return without outperforming simply holding the asset. It can look significant before costs or before correcting for the fact that many rules were tested, then fail after those adjustments.
A headline win rate normally hides those choices. Research is useful because it makes at least some of them visible.
What four studies found
The studies below do not test the same object. Treating them as four votes in one election would be a mistake. Their value is in showing how the answer changes with design.
| Study | Market and data | Test focus | Main finding |
|---|---|---|---|
| Marshall, Young & Rose (2006) | DJIA stocks, daily data, 1992–2002 | Candlestick trading rules with an OHLC bootstrap | The tested strategies did not add value for the DJIA sample. |
| Duvinage, Mazza & Petitjean (2013) | 30 DJIA constituents, 5-minute data | Intraday timing rules, costs and data-snooping correction | Some rules looked stronger initially; none beat buy-and-hold after costs and the stated bias correction. |
| Jönsson (2016 thesis) | 29 OMXS30 stocks, 2007–2015 | Short-term profitability and predictive power using GARCH-M and bootstrapping | The tested strategy was not profitable and showed no predictive power in that sample. |
| Tharavanij, Siraprapasiri & Rajchamaha (2017) | SET50 component stocks, daily data, 2006–2016 | Bullish and bearish reversal patterns, multiple holding periods, two exit methods and indicator filters | Most pattern returns were not statistically different from zero; direction was generally unreliable, and filters usually did not improve the result. |
Marshall, Young and Rose: a robust negative result for one market
The 2006 Journal of Banking & Finance paper tested candlestick strategies on Dow Jones Industrial Average stocks from 1992 to 2002. Its bootstrap method was designed to preserve the joint behavior of open, high, low, and close data rather than compare the rules with an unrealistic random series. The authors concluded that the tested candlestick strategies did not have value for those stocks.
That is strong evidence against a universal claim such as “candlestick patterns work on major US stocks.” It is not proof about every later period, asset class, timeframe, or rule definition.
Duvinage, Mazza and Petitjean: apparent edges shrink under stricter checks
The 2013 Quantitative Finance study moved to five-minute data for the 30 DJIA constituents. Its abstract reports that around one third of the candlestick rules initially outperformed buy-and-hold at a conservative significance level. After transaction costs, only a few remained profitable. After correcting for data snooping, no single rule in the tested timing framework beat buy-and-hold after costs; automated systems built from the best-performing rules also did not outperform.
This sequence matters. It demonstrates why “we tested many patterns and found a winner” is incomplete. The more rules, exits, filters, and horizons researchers try, the greater the chance that at least one looks good by luck. A correction for multiple searching asks whether the winner is still unusual after accounting for that search.
Jönsson: no predictive power in a Swedish large-cap sample
The 2016 Lund University thesis tested a candlestick-based strategy on 29 OMXS30 stocks from 2007 through 2015 using statistical models and bootstrapping. Its published abstract reports no short-term profitability and no predictive power in that sample.
As a bachelor’s thesis, it does not carry the same review status as a journal article. It is still useful as a transparent, market-specific test and as another warning against exporting a textbook claim into a different market without verification.
Tharavanij and colleagues: mostly weak results, plus an important literature disagreement
The 2017 SAGE Open article tested bullish and bearish reversal patterns in SET50 component stocks over ten years. It used holding periods of one, three, five, and ten days, two exit methods, and filters based on Stochastics, RSI, and the Money Flow Index.
The authors found that the mean returns of most patterns were not statistically different from zero. Their binomial tests indicated that the patterns generally could not reliably predict market direction. Even statistically significant cases carried high variability, and the indicator filters generally did not improve profitability or prediction accuracy.
Crucially, the paper’s literature review also records positive findings in some Taiwanese and Chinese equity studies, and it describes a US study in which profitability depended on the exit method. That is why “research proves candles do not work” would also be too broad. The published record is mixed, and methodological choices can change the conclusion.
Why one win rate cannot settle the question
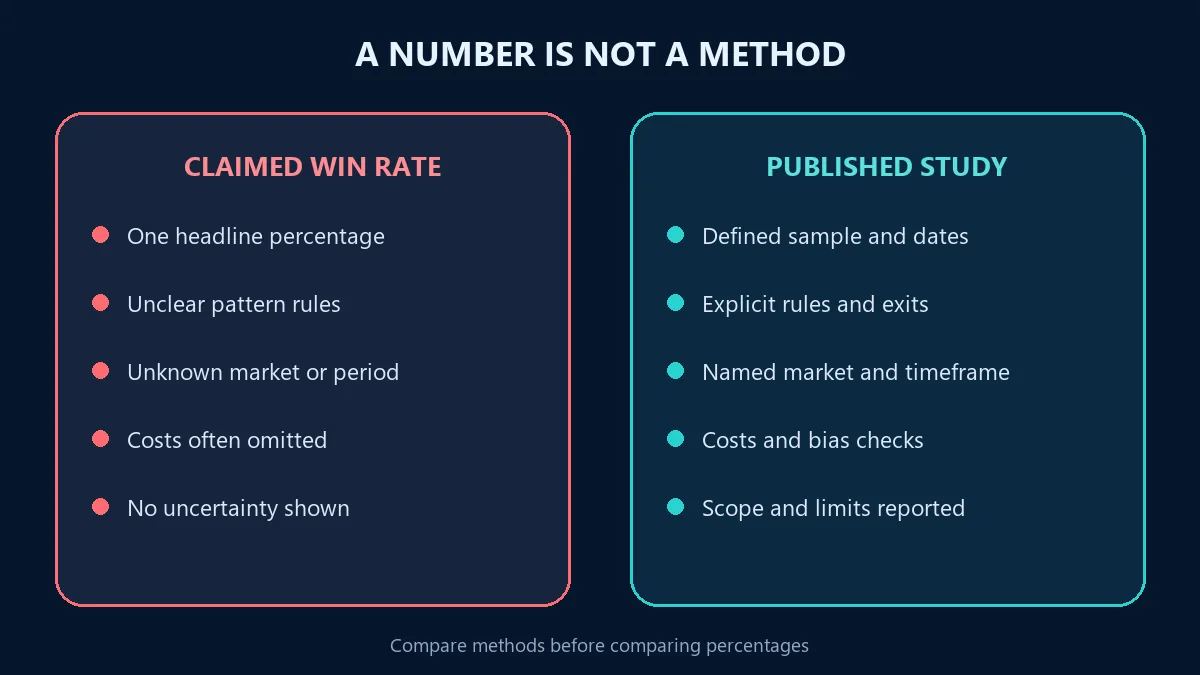
A credible result needs a denominator and a procedure. When you see “this pattern wins 72% of the time,” ask:
- Which exact pattern definition was used? A hammer can be coded with different body-to-shadow thresholds.
- What market, symbols, dates, and timeframe were included?
- What counted as a win, and when was the outcome measured?
- Were entries taken at the signal close, next open, or another price?
- What exit rule and holding period were used?
- Were spread, commission, slippage, and financing included where relevant?
- How many patterns, filters, and parameter combinations were tried?
- Was the reported result tested on data not used to choose the rule?
- How many independent cases were there?
- What uncertainty surrounded the estimate?
Without those answers, a percentage is a description of an unknown experiment. It is not transferable evidence.
The design choices that change the answer
Pattern definitions
Candlestick names look standardized, but implementations differ. One scanner may allow equality at body boundaries; another requires strict overlap. One hammer rule may require the lower shadow to be twice the body; another uses a different ratio or a rolling definition of “small.” Small changes alter which cases enter the sample.
Trend and context
Many reversal patterns presuppose a prior trend, but “trend” itself needs a rule. The SAGE Open paper reviews several definitions, including moving-average approaches. A test with no trend condition and a test with a specific trend filter are testing different strategies.
Exit rules and horizons
A pattern does not specify when to exit. Next-day direction, a three-day hold, a ten-day hold, a price target, and an opposite-signal exit can produce different results from the same entries. The literature reviewed by Tharavanij and colleagues specifically shows that exit design can reconcile apparently contradictory findings.
Benchmark and costs
Positive return is not the same as added value. A long-only rule may rise because the market rose. Comparing it with buy-and-hold, a matched random-entry rule, or a bootstrap distribution asks a harder question. Trading costs can erase small gross advantages, especially in frequent intraday strategies.
Multiple testing and selection
If a researcher tests dozens of patterns across many markets, timeframes, filters, and exits, the best result is selected from a large field. Ordinary significance tests may overstate its evidence unless the search is accounted for. Keeping the winning configuration secret makes the claim impossible to audit.
How to read a candlestick study methodically
Use a three-layer reading rather than jumping to the conclusion.
Layer 1: What exactly was tested?
Write down the sample, dates, timeframe, pattern rules, trend definition, entry, exit, and costs. If any are missing, mark the result as hard to reproduce.
Layer 2: What was the comparison?
Identify whether the paper tested direction, raw returns, abnormal returns, or performance relative to a benchmark. Note whether it corrected for trying many rules and whether the finding was in-sample or out-of-sample.
Layer 3: How far does the conclusion travel?
Restate the finding with its boundaries. “No value for the tested DJIA rules from 1992–2002” is faithful. “Candlesticks never work” is not. Likewise, “some Taiwan-market rules were significant under a specific method” does not become “candlesticks work everywhere.”
A practical test for your own market
The research suggests no universal setting to adopt. It suggests a method for asking a narrower question:
- Define one pattern mechanically before looking at results.
- Choose one market, timeframe, and session convention.
- Define any required prior trend or context as a separate rule.
- Write the entry, exit, and unresolved-trade treatment in advance.
- Record spread, commission, and a defensible slippage assumption.
- Keep an untouched out-of-sample period or collect forward cases.
- Report trade count, average outcome, payoff distribution, drawdown, and uncertainty—not win rate alone.
- Document every variant tested, including the ones that failed.
This does not guarantee that the next sample will resemble the last. It makes the result inspectable and reduces the temptation to redefine the pattern after seeing the outcome.
So, are candlestick patterns reliable?
Not as a universal category. The evidence reviewed here is mostly weak or negative for the particular US, Swedish, and Thai large-cap samples tested, especially after stricter controls. The broader literature contains positive pockets in other markets and under other exit designs. That combination is best described as mixed and conditional, not proven and not uniformly disproven.
Candlesticks can still be useful as a standardized vocabulary for documenting price behavior. But a recognizable shape is not evidence of a durable trading edge. Reliability belongs to a fully specified rule in a defined dataset, with costs, uncertainty, and an honest benchmark—not to the pattern name by itself.
Bottom line
Do candlestick patterns actually work? Published research does not provide a single transferable win rate. Several careful tests found no reliable value in their samples; other studies found limited, market- or method-dependent effects. The responsible conclusion is to treat every pattern claim as a hypothesis, preserve the exact definition, and test it in the market and timeframe where you intend to evaluate it.
FAQ
Do candlestick patterns actually work?
Research does not support one universal answer. Several studies found little or no value in their samples, while others found limited effects in particular markets or under specific exit rules. The result belongs to the complete method, not the pattern name alone.
Are candlestick patterns reliable on their own?
No pattern family has a universally reliable success rate. Reliability must be evaluated for an exact definition, market, timeframe, context, entry, exit, costs, and test period.
Why do candlestick studies disagree?
They test different markets, dates, timeframes, pattern definitions, trend filters, holding periods, exit methods, benchmarks, and cost assumptions. They also differ in how they control for data snooping and out-of-sample performance.
What is wrong with a published win rate?
A percentage is not interpretable without the number of cases, definition of a win, payoff sizes, sample dates, costs, and uncertainty. It may also be the best result selected from many unreported tests.
Do indicators make candlestick patterns more reliable?
Not automatically. The 2017 SET50 study found that Stochastics, RSI, and MFI filters generally did not improve profitability or prediction accuracy. Any filter should be treated as a separate hypothesis and tested.
How should I test a candlestick pattern?
Define the pattern, context, entry, exit, costs, and unresolved-trade rules before seeing results. Keep an out-of-sample or forward sample, record every variant tested, and report payoff and uncertainty alongside win rate.
References
- Marshall, Young & Rose (2006) — Candlestick technical trading strategies: Can they create value for investors?sciencedirect.com · accessed 2026-08-06
- Duvinage, Mazza & Petitjean (2013) — The intra-day performance of market timing strategies based on Japanese candlestickseconbiz.de · accessed 2026-08-06
- Jönsson (2016) — The Predictive Power of Candlestick Patternslup.lub.lu.se · accessed 2026-08-06
- Tharavanij, Siraprapasiri & Rajchamaha (2017) — Profitability of Candlestick Charting Patterns in the Stock Exchange of Thailandjournals.sagepub.com · accessed 2026-08-06
DisclosureFor informational purposes only. Stick Stock gives no buy or sell recommendations and executes no trades.